pfSense Monitoring with Check_MK
For the monitoring of our network infrastructure we use Check_MK. Check_MK supports a variety of services and agents. Data can be monitored with the Check_MK agent, SNMP or simply by ping. In the past, we used to monitor our firewall via SNMP, which is already integrated in pfSense (You can enable SNMP via Services → SNMP). This already covers most of the services, such as all network interfaces. But some important information is missing. This includes the current CPU load or the hard disk(s). To get this information, we need the Check_MK agent on the firewall.
Installing the Check_Mk Agent in pfSense
I’ll describe the installation via a SSH connection to firewall. Alternatively, you can also enter all commands under Diagnostics → Command Prompt.
The Check_MK-Agent is a bash script. Therefore bash must be installed first:
$ pkg install -y bash
Then we create two directories:
$ mkdir -p /opt/bin
$ mkdir -p /opt/etc/xinetd.d
Next, we need to download the Check_MK-Agent to our newly created directory and then make it executable:
$ curl --output /opt/bin/check_mk_agent 'https://git.mathias-kettner.de/git/?p=check_mk.git;a=blob_plain;f=agents/check_mk_agent.freebsd;hb=HEAD'
$ chmod +x /opt/bin/check_mk_agent
The data of the Check_MK agent is retrieved via telnet. Therefore we need a configuration file. To do this, copy the following content (preferably via Diagnostics → Edit file) to the file /opt/etc/xinetd.d/check_mk:
# +------------------------------------------------------------------+
# |             ____ _               _        __  __ _  __           |
# |            / ___| |__   ___  ___| | __   |  \/  | |/ /           |
# |           | |   | '_ \ / _ \/ __| |/ /   | |\/| | ' /            |
# |           | |___| | | |  __/ (__|   (    | |  | | . \            |
# |            \____|_| |_|\___|\___|_|\_\___|_|  |_|_|\_\           |
# |                                                                  |
# | Copyright Mathias Kettner 2014             [email protected] |
# +------------------------------------------------------------------+
#
# This file is part of Check_MK.
# The official homepage is at http://mathias-kettner.de/check_mk.
#
# check_mk is free software;  you can redistribute it and/or modify it
# under the  terms of the  GNU General Public License  as published by
# the Free Software Foundation in version 2.  check_mk is  distributed
# in the hope that it will be useful, but WITHOUT ANY WARRANTY;  with-
# out even the implied warranty of  MERCHANTABILITY  or  FITNESS FOR A
# PARTICULAR PURPOSE. See the  GNU General Public License for more de-
# ails.  You should have  received  a copy of the  GNU  General Public
# License along with GNU Make; see the file  COPYING.  If  not,  write
# to the Free Software Foundation, Inc., 51 Franklin St,  Fifth Floor,
# Boston, MA 02110-1301 USA.

service check_mk
{
    type           = UNLISTED
    port           = 6556
    socket_type    = stream
    protocol       = tcp
    wait           = no
    user           = root
    server         = /opt/bin/check_mk_agent

    # If you use fully redundant monitoring and poll the client
    # from more then one monitoring servers in parallel you might
    # want to use the agent cache wrapper:<br />

    #server         = /usr/bin/check_mk_caching_agent

    # configure the IP address(es) of your Nagios server here:
    #only_from      = 127.0.0.1 10.0.20.1 10.0.20.2

    # Don't be too verbose. Don't log every check. This might be
    # commented out for debugging. If this option is commented out
    # the default options will be used for this service.
    log_on_success =

    disable        = no
}
Now we have to configure some filter settings. The following script makes the necessary changes in the file /etc/inc/filter.inc automatically. To do this, create the file /opt/filter_check_mk_cron (again with Diagnostics → Edit file).
#!/bin/sh

grep includedir /etc/inc/filter.inc
if [ $? -eq 0 ]
then
        exit 0
else
        awk '/fclose\(\$xinetd_fd\)\;/{print "fwrite($xinetd_fd, \"includedir /opt/etc/xinetd.d\");"}1' /etc/inc/filter.inc > /etc/inc/filter.inc.temp
        mv /etc/inc/filter.inc.temp /etc/inc/filter.inc
fi
exit 0
We have to set the executable bit again and run it.
$ chmod +x /opt/filter_check_mk_cron
$ ./opt/filter_check_mk_cron
Finally, reload the filters (via Status → Filter Reload) and now we can check if the Check_MK-Agent works (adjust IP of the firewall accordingly):
$ telnet 192.168.1.1 6556
If everything is configured correctly, you should see the output of the Check_MK agent.
Setting up pfSense on Check_MK Server
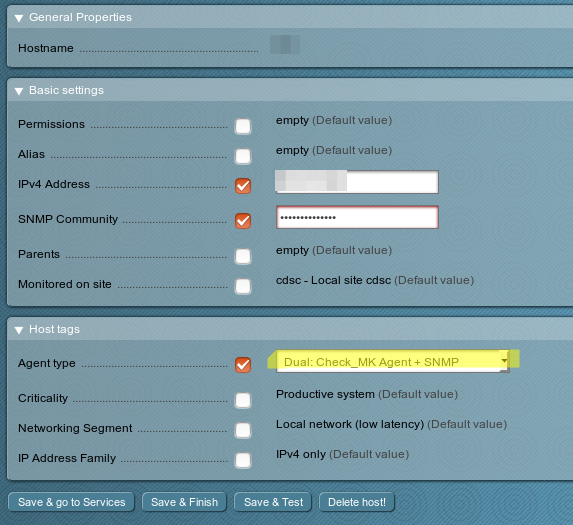
Now we have to add the firewall as a host in Check_MK or edit the existing host in WATO. In addition to the IP, SNMP community and hostname, we select Dual Check: Check_MK Agent + SNMP as the agent type. With a click on Save & go to Services we can activate the desired services.
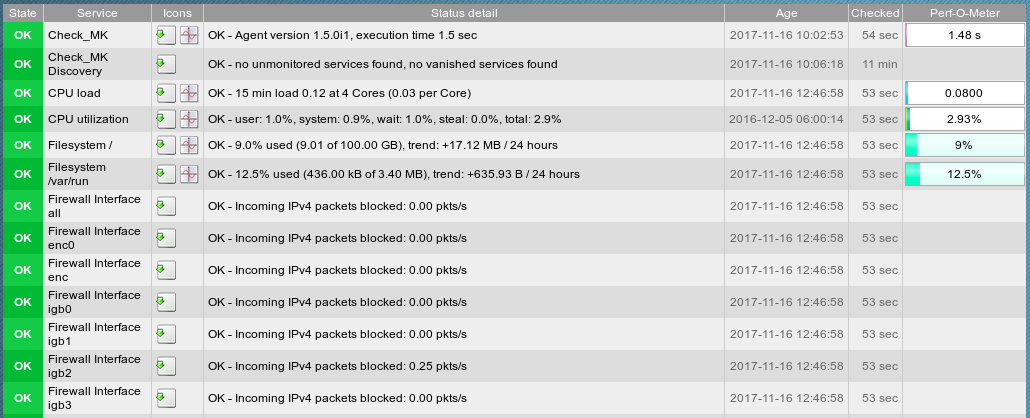
Now all important information is always available at a glance. Here is an excerpt:
Conclusion
Check_MK is a very flexible and great monitoring software. We have been using it for some time now in our school and the possibilities for customization are almost infinite as far as the notifications and devices to be monitored are concerned.
What software do you use for monitoring?
Looking for high quality Open Source Apps for your classroom?


0 Comments