How To Measure Particulate Matter With a Raspberry Pi
We regularly measure particulate matter in the air at our school. Particularly between February and May the values here in South-East Asia are very high, because it hardly rains during this time, it is very dry and hot and many meadows and fields are burned down. All this has a negative effect on the quality of the air. Today I would like to show you how to measure particulate matter with a Raspberry Pi. However, I would like to comment briefly on the question first: What is particulate matter and what do we want to measure?
What is particulate matter?
It can be said quite roughly that fine dust is a very small particle in the air. A distinction is made between PM10 and PM2.5. PM10 is all particles in the air that are smaller than 10µm, whereas PM2.5 is all particles that are smaller than 2.5µm. The smaller the particles, i. e. everything smaller than 2.5µm, the more dangerous they are to health as they can penetrate into the alveoli.
The WHO recommends the following limit values, for example:
- Annual average PM10 20 µg/m³
- Annual average PM2,5 10 µg/m³ per year
- Daily average PM10 50 µg/m³ without permitted days on which exceeding is possible.
- Daily average PM2,5 25 µg/m³ without permitted days on which exceeding is possible.
These values are below the limits set in most countries. In e.g. the European Union, an annual average of 40 µg/m³ for PM10 is allowed.
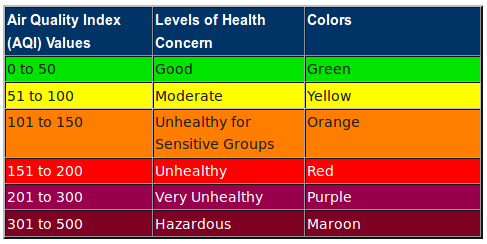
What is the Air Quality Index (AQI)?
The Air Quality Index can be calculated on the basis of the particulates in the air. It indicates how “good” or “bad” the air is straight. Unfortunately, there is no uniform standard here, because different countries calculate this differently or have different scales. The Wikipedia article on the Air Quality Index provides a good overview. At our school, we are guided by the classification established by the EPA (United States Environmental Protection Agency).
So much for a brief outline on the subject of particulate matter and AQI.
What do we need for measuring particulate matter?
Actually, it only takes two things:
- a Raspberry Pi (every model works, best a model with WiFi)
- Particulates sensor SDS011
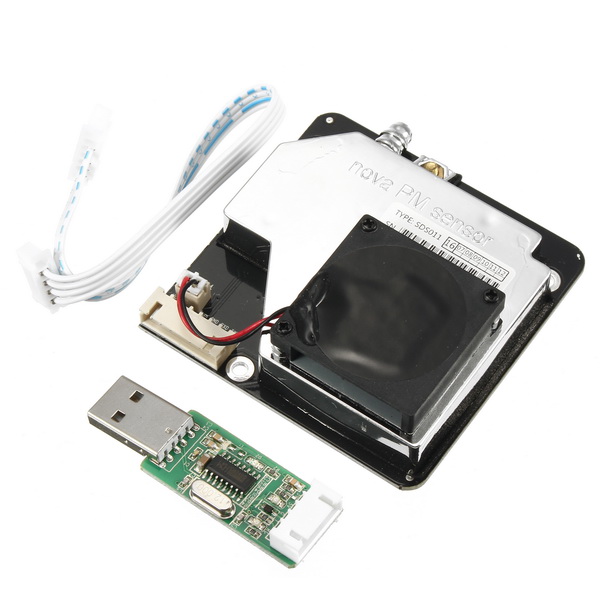
That’s it 🙂 Whoever chooses a Raspberry Pi Zero W needs an adapter cable to a standard USB port, because the Zero has only Micro-USB. The sensor is best purchased at Aliexpress. It’s about $17-20 there. The sensor comes with a USB adapter for the serial interface.
Installation
For our Raspberry Pi we download the corresponding Raspbian Lite Image and write it on the Micro-SD card. This is documented here, for example. At this point, I will not go into setting up the WLAN connection. There are many tutorials on the net.
If you want to have SSH enabled after booting, you need to create an empty file named ssh in the boot partition. The IP of the Raspberry Pis can best be obtained via your own router / DHCP server. You can then log in via SSH (default password is raspberry):
$ ssh [email protected]
For our sensor we use a small Python module, which saves us a lot of work. To do this we need to install some packages and clone the repository on the Pi.
$ sudo apt install git-core python-serial python-enum lighttpd
Before we can start the program, we need to know which serial port the USB adapter is connected to. dmesg helps us:
$ dmesg
[ 5.559802] usbcore: registered new interface driver usbserial
[ 5.559930] usbcore: registered new interface driver usbserial_generic
[ 5.560049] usbserial: USB Serial support registered for generic
[ 5.569938] usbcore: registered new interface driver ch341
[ 5.570079] usbserial: USB Serial support registered for ch341-uart
[ 5.570217] ch341 1-1.4:1.0: ch341-uart converter detected
[ 5.575686] usb 1-1.4: ch341-uart converter now attached to ttyUSB0
In the last line you can see our interface: ttyUSB0. We now need two things: a small Python script that reads the data and saves it in a JSON file, and then we will create a small HTML page that reads and displays the data.
Reading data on the Raspberry Pi
We first create an instance of the sensor and then read the sensor every 5 minutes for 30 seconds. These values can of course be adjusted. Between the measuring intervals, we put the sensor into a sleep mode to increase its life span (according to the manufacturer, the lifetime is approx. 8000 hours).
[Update, 27.02.2018] I noticed that my Python3 version of the script could not access the serial ports, e.g. after a reboot. The data could only be read after starting the script several times. I didn’t find out why, but with Python2.7 it works without any problems. So here is a new version of the script based on Python2.7.
In the home directory we create a file named aqi.py and copy the following content into it:
#!/usr/bin/python
# coding=utf-8
# "DATASHEET": http://cl.ly/ekot
# https://gist.github.com/kadamski/92653913a53baf9dd1a8
from __future__ import print_function
import serial, struct, sys, time, json

DEBUG = 0
CMD_MODE = 2
CMD_QUERY_DATA = 4
CMD_DEVICE_ID = 5
CMD_SLEEP = 6
CMD_FIRMWARE = 7
CMD_WORKING_PERIOD = 8
MODE_ACTIVE = 0
MODE_QUERY = 1

ser = serial.Serial()
ser.port = "/dev/ttyUSB0"
ser.baudrate = 9600

ser.open()
ser.flushInput()

byte, data = 0, ""

def dump(d, prefix=''):
    print(prefix + ' '.join(x.encode('hex') for x in d))

def construct_command(cmd, data=[]):
    assert len(data) <= 12
    data += [0,]*(12-len(data))
    checksum = (sum(data)+cmd-2)%256
    ret = "\xaa\xb4" + chr(cmd)
    ret += ''.join(chr(x) for x in data)
    ret += "\xff\xff" + chr(checksum) + "\xab"

    if DEBUG:
        dump(ret, '> ')
    return ret

def process_data(d):
    r = struct.unpack('<HHxxBB', d[2:])
    pm25 = r[0]/10.0
    pm10 = r[1]/10.0
    checksum = sum(ord(v) for v in d[2:8])%256
    return [pm25, pm10]
    #print("PM 2.5: {} μg/m^3  PM 10: {} μg/m^3 CRC={}".format(pm25, pm10, "OK" if (checksum==r[2] and r[3]==0xab) else "NOK"))

def process_version(d):
    r = struct.unpack('<BBBHBB', d[3:])
    checksum = sum(ord(v) for v in d[2:8])%256
    print("Y: {}, M: {}, D: {}, ID: {}, CRC={}".format(r[0], r[1], r[2], hex(r[3]), "OK" if (checksum==r[4] and r[5]==0xab) else "NOK"))

def read_response():
    byte = 0
    while byte != "\xaa":
        byte = ser.read(size=1)

    d = ser.read(size=9)

    if DEBUG:
        dump(d, '< ')
    return byte + d

def cmd_set_mode(mode=MODE_QUERY):
    ser.write(construct_command(CMD_MODE, [0x1, mode]))
    read_response()

def cmd_query_data():
    ser.write(construct_command(CMD_QUERY_DATA))
    d = read_response()
    values = []
    if d[1] == "\xc0":
        values = process_data(d)
    return values

def cmd_set_sleep(sleep=1):
    mode = 0 if sleep else 1
    ser.write(construct_command(CMD_SLEEP, [0x1, mode]))
    read_response()

def cmd_set_working_period(period):
    ser.write(construct_command(CMD_WORKING_PERIOD, [0x1, period]))
    read_response()

def cmd_firmware_ver():
    ser.write(construct_command(CMD_FIRMWARE))
    d = read_response()
    process_version(d)

def cmd_set_id(id):
    id_h = (id>>8) % 256
    id_l = id % 256
    ser.write(construct_command(CMD_DEVICE_ID, [0]*10+[id_l, id_h]))
    read_response()

if __name__ == "__main__":
    while True:
        cmd_set_sleep(0)
        cmd_set_mode(1);
        for t in range(15):
            values = cmd_query_data();
            if values is not None:
                print("PM2.5: ", values[0], ", PM10: ", values[1])
                time.sleep(2)

        # open stored data
        with open('/var/www/html/aqi.json') as json_data:
            data = json.load(json_data)

        # check if length is more than 100 and delete first element
        if len(data) > 100:
            data.pop(0)

        # append new values
        data.append({'pm25': values[0], 'pm10': values[1], 'time': time.strftime("%d.%m.%Y %H:%M:%S")})

        # save it
        with open('/var/www/html/aqi.json', 'w') as outfile:
            json.dump(data, outfile)

        print("Going to sleep for 5min...")
        cmd_set_mode(0);
        cmd_set_sleep()
        time.sleep(300)
Or you can just run that:
$ wget -O /home/pi/aqi.py https://raw.githubusercontent.com/zefanja/aqi/master/python/aqi.py
In order for the script to run without errors, two small things are still needed:
$ sudo chown pi:pi /var/www/html/
$ echo [] > /var/www/html/aqi.json
Now you can start the script:
$ chmod +x aqi.py
$ ./aqi.py
PM2.5:55.3, PM10:47.5
PM2.5:55.5, PM10:47.7
PM2.5:55.7, PM10:47.8
PM2.5:53.9, PM10:47.6
PM2.5:53.6, PM10:47.4
PM2.5:54.2, PM10:47.3
...
Run the script automatically [Update]
So that we don’t have to start the script manually every time, we can let it start with a cronjob e.g. with every restart of the Raspberry Pis. To do this, open the crontab file
$ crontab -e
and add the following line at the end:
@reboot cd /home/pi/ && ./aqi.py
Now our script starts automatically with every restart.
HTML page for display of measured values and AQI
We have already installed a lightweight webserver lighttpd. So we have to save our HTML, Javascript and CSS files in the directory /var/www/html/ so that we can access the data from another computer / smartphone. With the next three commands we simply download the corresponding files:
$ wget -O /var/www/html/index.html https://raw.githubusercontent.com/zefanja/aqi/master/html/index.html
$ wget -O /var/www/html/aqi.js https://raw.githubusercontent.com/zefanja/aqi/master/html/aqi.js
$ wget -O /var/www/html/style.css https://raw.githubusercontent.com/zefanja/aqi/master/html/style.css
The main work is done in the Javascript file, which opens our JSON file, takes the last value and calculates the AQI based on this value. Then the background colors are adjusted according to the scale of the EPA.
Now you simply open the address of the Raspberry Pis in your browser and look at the current particulates values, e.g. http://192.168.1.5:
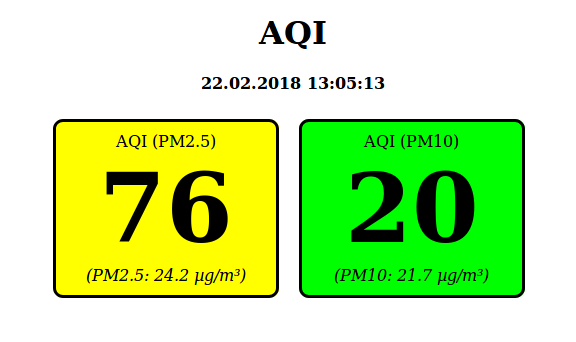
The page is very simple and can be extended, e.g. with a chart showing the history of the last hours, etc. Pull requests are welcome 🙂 The complete source code is on Github.
Conclusion
For relatively little money we can now measure particulate matter with a Raspberry Pi. Whether permanently installed outdoors or as a mobile measuring device – there are many possible applications. At our school we have both in use. On the one hand, there is a sensor that measures outdoor values day and night, and a mobile sensor that checks the effectiveness of our air condition filters in the classrooms.
At http://luftdaten.info there is another possibility to build a similar sensor. The software is delivered ready to use and the measuring device is even more compact, because no Raspberry Pi is used. Great project!
A particulates sensor is a project that can be implemented well with students in computer science classes or a workshop!
Also check out our following post, where we add a touch screen to the Raspberry Pi to have a full mobile sensor!
What do you use a Raspberry Pi for?


3 Comments
Unable to read data from SDS011 – Ask python questions · June 9, 2021 at 3:13 pm
[…] Try to connect this SDS011 directly to RPi, not from USB – same issue. Try to execute this code and it’s read data from the module, but don’t want to use it. Do you have any ideas, […]
How do I get a floating point value to show up in Google Chart? – Ask Javascript Questions · July 21, 2021 at 7:03 am
[…] that collects the raw PM data and then converts it to AQI numbers that are displayed on a web page (https://openschoolsolutions.org/measure-particulate-matter-with-a-raspberry-pi/). But the historical data it collects is presented in a table which I really want shown as a graph. […]
How do I get a floating point value to show up in Google Chart? – Ask python questions · July 21, 2021 at 8:13 am
[…] that collects the raw PM data and then converts it to AQI numbers that are displayed on a web page (https://openschoolsolutions.org/measure-particulate-matter-with-a-raspberry-pi/). But the historical data it collects is presented in a table which I really want shown as a graph. […]